


![]()
![]()
![]()
![]()
Page 13
EFFICIENCY IN ECHO
As mentioned in the performance framework section, ECHO is interested in assessing healthcare performance by analysing different dimensions; equity of access, effectiveness, and quality and safety. ECHO has also explored several research lines in order to provide insight into the level of efficiency of health care providers.
This section of the Handbook provides a general view of the different measures of efficiency used in ECHO: hospital efficiency; association between resources and outcomes; and the potential for minimisation of lower-value care utilisation as a proxy of value-for-money losses in the system (resource allocation leading to lower quality and safety of care, i.e., inefficiency).
1. Hospital productivity
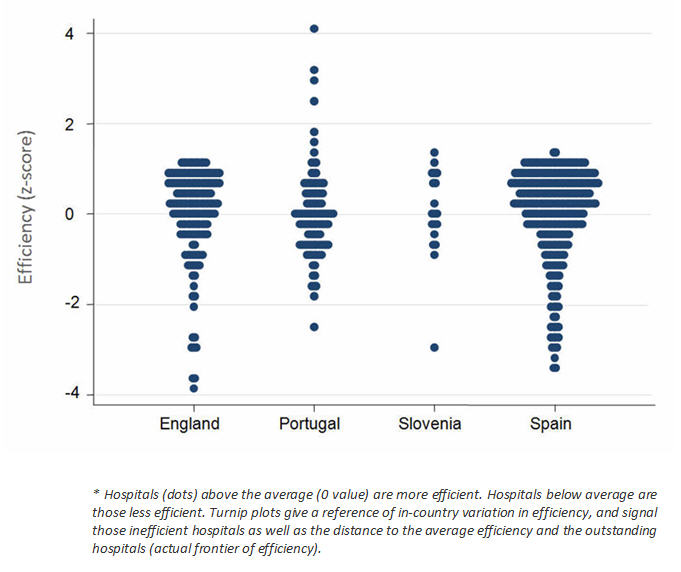
In this approach, ECHO defines efficiency as the maximization of the output for a given level of input. Outputs are hospital discharges adjusted by a relative weight according to the patient classification system used in each country, and inputs are employees (e.g., physicians or nurses) and beds.
The analytical approach is based on Stochastic Frontier Analysis (SFA), a parametric method used to estimate optimal production functions. One of the advantages of SFA is its capacity to identify systematic differences in efficiency as well as random fluctuations beyond the control of the hospital.
SFA ultimately identifies hospitals at the frontier of efficiency and inefficient hospitals, and provides a measure of “distance” to the frontier.
The turnip plot is a typical output of SFA analyses in ECHO; in-country efficiency dispersion is shown in the figure below.
2. Association between Length of Stay and Hospital Outcomes
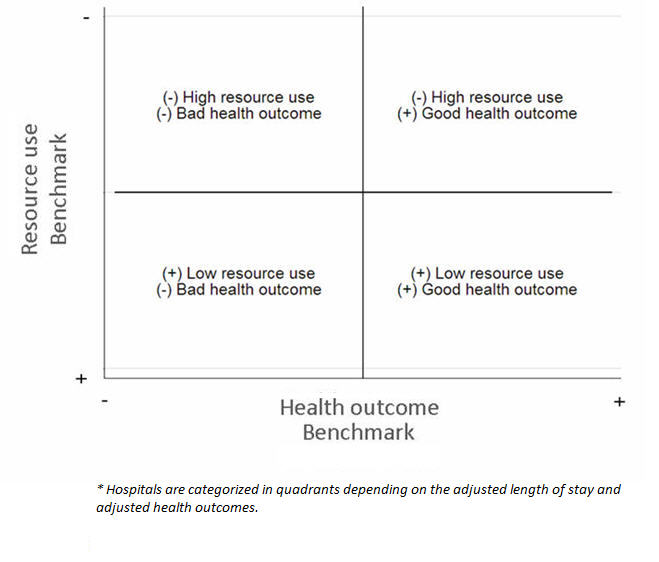
This approach to estimating hospital efficiency profiles hospitals in terms of their consumption of resources and their effectiveness. Specifically, a general pattern of length of stay (LOS) and mortality is estimated across hospitals (providing a common benchmark) to determine whether hospitals that provide high quality care also have a low level of resource consumption.
Thus, mortality rates after specific procedures or in defined conditions are used to obtain a measure of hospital effectiveness, while LOS is used as surrogate for resource consumption.
Statistically, common benchmarks are obtained from hierarchical regressions; Poisson in the case of LOS and logit for mortality. Adjusted LOS and mortality rates for each hospital are then calculated and positioned relative to common benchmarks.
The typical output from this approach is the categorization of hospitals into four quadrants, as shown in the figure below.
3. Excess-LOS in patients suffering an adverse event
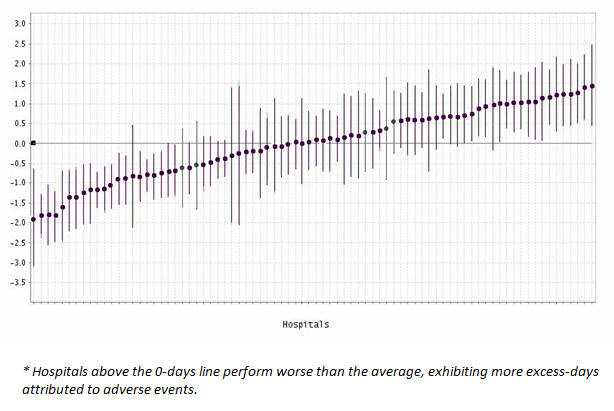
This approach to measuring hospital efficiency profiles hospitals in terms of their resource consumption and their safety. What is measured is the excess resource consumption due to an adverse event that is attributable to hospital care.
The excess consumption of resources is estimated using length of stay (in surviving patients) and various ECHO-validated patient safety indicators that represent adverse events.
Excess LOS is estimated using logit hierarchical models where the presence of an adverse event and the propensity for a patient to suffer an adverse event are the main endogenous variables.
The outputs of this type of analysis are excess days of stay per hospital and the relative position of a hospital relative to the average behaviour of the group of hospitals involved in the comparison.
4. Minimisation of value-for-money losses
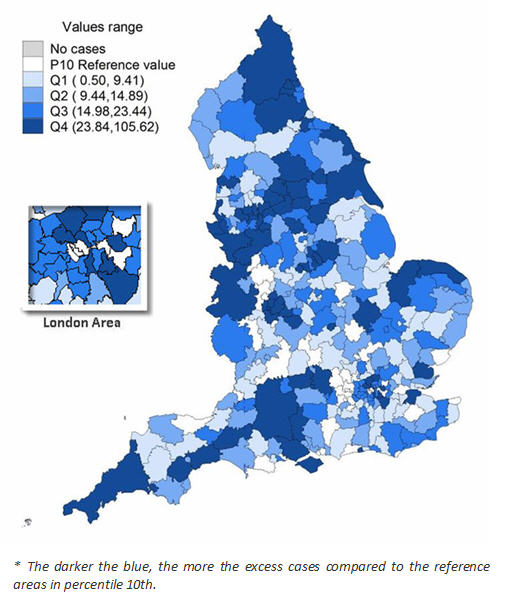
Unlike previous examples in which the analysis of efficiency focused on hospitals, the minimisation of value-for-money losses is performed at the population level. The rationale behind this approach is that utilisation of lower-value care entails a loss of value-for-money within the health system (allocation of resources that leads to lower quality and safety of care, i.e., inefficiency). Typically, these phenomena occur at the local level, giving rise to differential exposure or access to services depending on the place of residence (often described as the “post-code lottery”).
Low-value procedures are defined in ECHO as procedures that: a) may be effective, but have been superseded by more cost-effective alternatives; b) are performed in patients for whom evidence of value is unclear; or c) are ineffective in most cases, but are widely used. Examples of low-value procedures are tonsillectomy in children, C-section in low-risk deliveries, and radical mastectomy in breast cancer.
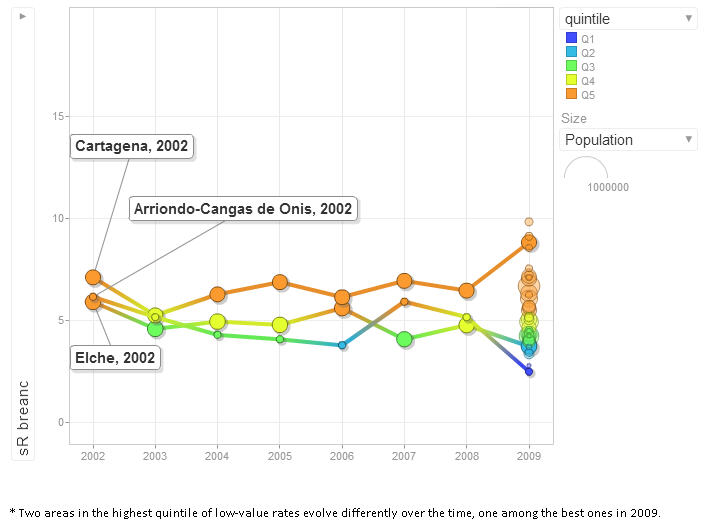
This approach analyses the actual utilisation rate per 10,000 inhabitants in each geographical area and compares it to 2 scenarios depicting the “minimisation of lower-value care use”: 1) All the areas in the country behave as those below the 10th percentile of LVC utilisation (the 10% of areas at the lower end of the spectrum of use); 2) All areas in the country behave as those in the first quartile of LVC utilisation (the 25% of areas at the lower end of the spectrum of use). The potential for realignment is determined as the difference between the number of procedures observed and the number expected if LVC utilisation were minimised.
Typical outputs of this analysis are maps depicting excess-cases and trend-rate bubble plots depicting the evolution of the excess-cases, or the standardized average rate.
Please cite this publication as:
European Collaboration for Healthcare Optimization (ECHO) https://cienciadedatosysalud.org/echo/ . Zaragoza (Spain): Instituto Aragonés de Ciencias de la Salud - Instituto Investigación Sanitaria Aragón; c2011. García-Armesto S, Mateus C, Nunes C, Joaquim I, Gutacker N, Bernal-Delgado E on behalf of the ECHO consortium. Handbook on methodology: Measurement of efficiency; 2014 Apr 27 [ accessed date ]; Available from: https://cienciadedatosysalud.org/atlasvpm/ECHO/handbook_14102014/efficiency.html
![]()
![]()
![]()
![]()
Page 13