


![]()
![]()
![]()
![]()
Page 6
INTERNATIONAL COMPARISON
UPCOMING ENTRIES:
3. COMPARING HETEROGENEOUS GEOGRAPHIC AREAS
Abstract
Studies of geographic variation aim to identify systematic variation, i.e.,variation not attributable to chance. One variable that can jeopardize this goal is the extravariation associated with the heterogeneity of population sizes across geographic areas. ECHO has approached this problem by creating new hospital-based areas in countries with more heterogeneous population sizes.
The problem
As mentioned in"basic statistics in ECHO", the analytical arsenal used to study and report variation is based on measuring differences in the amount of services provided within a defined geographic unit of analysis ( i.e., region, healthcare area, municipality). Analytically, variation can be measured in terms ofthe differences in age- and sex-standardized rates of a procedure ( i.e., rates ratio), as variation not deemed random ( i.e., systematic component of variation) and by way of the differential risk for a specific population as compared with a standard risk ( i.e., standardized utilization ratio).
Obtaining sounder estimates of variation requires paying attention to the units of analysis and the variation estimators. A critical issue with units of analysis is their population’s size heterogeneity;the greater the heterogeneity the greater the likelihood of observing extra-variation attributable to the population´s size rather than to variations in practice. As for variation estimators, their robustness depends on the basal prevalence of the event of interest;the lower the prevalence the greater the likelihood of finding extra-variation attributableto small numbers.
The aforementioned issues are even more important in international comparisons, which involve the comparison of units of enormous heterogeneity, both in size and event prevalence, within and across countries.
ECHO involvesfour differentunits of analysis (MAREs),thesmallestbeing MARE4. In ECHO,93.9% of the municipalities and 91.8% of health authorities contain less than 100,000 inhabitants in Denmark and England, respectively, whereas in Portugal and Spain only 32.4% of concelhos (municipalities) and 26.1% of the healthcare areas contain less than 100,000 inhabitants (Table 1).
Methodological alternatives
Several methods can be used to deal with extra-variation when comparing smallwith large areas, and low with high incidence rates. The aim of these methods is to stabilize observations to limit the effect of chance. The simplest approach is to aggregate events following a practical/pragmatic criterion (e.g., pooling several years or merging units of analysis). More sophisticated approaches attempt to smoothing heterogeneity using Bayesian mathematics. The former, more pragmatic method misses relevant information; for example, when pooling years, time-dependent effects cannot be observed, and when aggregating units of analysis, the new areas may not be significant from the decision-makers’ perspective. In turn, the Bayesian approach may overly smooth downrisks, flagging geographical units as false negatives when, in fact, the risk of exposure statistically differs to the expected.
The ECHO approach: building an intermediate layer
To reduce heterogeneity while preserving the meaningfulness of the units of analysis for decision-making purposes, ECHO has created intermediate sized areas based on actual population exposure to hospital care.
The construction of these new units of analysis had to achieve two objectives: 1) to reflect the actual population exposure to hospital care, and 2) to respect the limits of the existing upper administrative level (namely, MARE 2).
Methodology
The methodology used involved two main steps. The first step aimed at delineating“stable boundaries” based on exposure to the “usual provider”; to this end, all elective admissions and elective day-case care contacts were allocated to the patient’s place of residence. Discharges from hospitals not included in the ECHO hospital catalogue (less than 1%) and patients from unidentified municipalities (less than 1% of discharges) were excluded.
The second step sought to define the new boundaries. To this end, distinct matrices for hospital admission and day-case care were constructed. In addition, a subordinated rule was created in which the inpatient matrix predominates as the main structure, subordinating the outpatient structure. For example, if most outpatient episodes in municipality X received care in hospital 1, but inpatient care was mainly provided in hospital 2 in municipality Y, the subordination rule forces population X to be assigned to municipality Y.
Complementary geometric techniques were used to decide where to allocate the smallest geographic units (e.g., municipalities), specifically, the k-means algorithm (using the geometric distance across area centro ids)and the Ward algorithm (in which geometric distance is weighted using variation both between and within areas).
Results
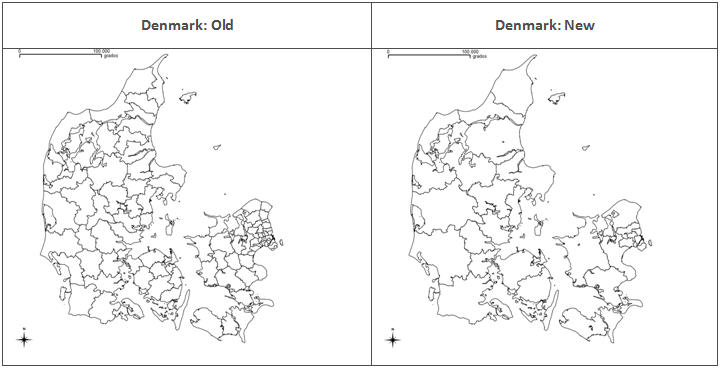
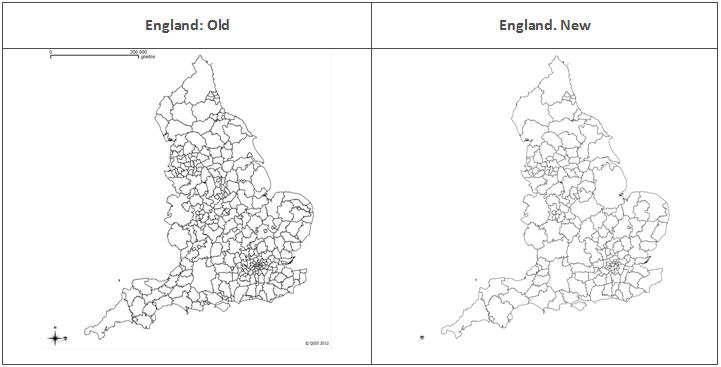
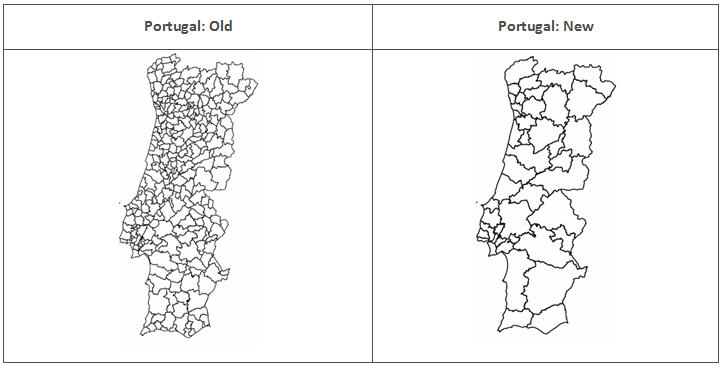
Table 1showsthe new distribution of population size, and the maps in Figure 1show the differences between the oldand the new units of analysis. The countries for which stabilization was required were England, Denmark and Portugal. This approach was not required for Spain, where healthcare areas (MARE3) were originally built around hospital care and “catchment” areas are stable over time, or Slovenia and Austria, whose smaller areas are classed as MARE 2 due to privacy protection restrictions.
Table1. Distribution of the population in the new and the old areas, for Denmark, England and Portugal
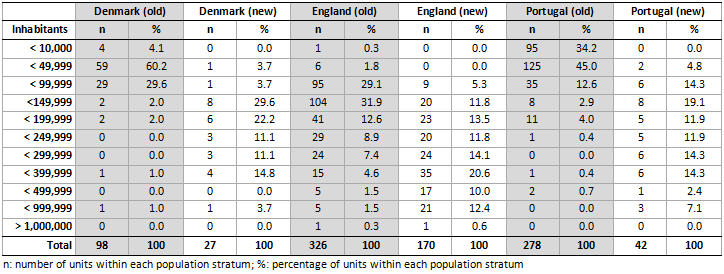
Figure 1. Old and new units:
a. Dennmark |
b. England |
c. Portugal |


Implications for research
Beyond some differences in the local interpretation of variation and rates using the new geographical units, creating larger units of analysis resulted in a change in the estimates of variation. Specifically, the new approach resulted in less extreme values and lower exposure to random phenomena. A better understanding of the implications of using these new areas of analysis is required, e.g., by observing and empirically comparing the ECHO statistics for variation in the old and the newly created ECHO areas.
All these concerns are addressed in the ECHO case study“Comparing geographic variation across ECHO countries: providing sounder estimates while preserving meaningful observations”.
KEY POINTS
• Heterogeneity in population size across areas is a majorchallenge inanalyses of geographic variation, particularly when several countries are involved.
• The usual approach (aggregating years or units of analyses) entails a loss of relevant information, which is critical to inform decision-makers.
• Creating new areas based upon the actual experience of the populations seeking care reduces extra-heterogeneity while keeping the units of analysis meaningful.
Please cite this publication as:
European Collaboration for Healthcare Optimization (ECHO) https://cienciadedatosysalud.org/echo/ . Zaragoza (Spain): Instituto Aragonés de Ciencias de la Salud - Instituto Investigación Sanitaria Aragón; c2011. Thygesen LC, Baixauli C, Librero J, Bernal-Delgado E on behalf of the ECHO consortium. Handbook on methodology: Comparing heterogeneous geographic areas; 2014 Apr 27 [ accessed: date ]; Available from: https://cienciadedatosysalud.org/atlasvpm/ECHO/handbook_14102014/unit_analysis.html
![]()
![]()
![]()
![]()
Page 6