1.
1.2.
Magnitude of an event: Crude incidence, adjusted incidence
Incidence, either crude or standardised, is representing the magnitude of a phenomenon; in this case, the risk for a patient to experience an event in the hospital where he or she has been treated, in a period of time. Events in ECHO are generally undesirable outcomes- case-fatalities and patient-safety indicators.
While the crude incidence is straightforwardly calculated, the numerator is represented by the number of events and the denominator by the number of patients at risk (usually per 100 or 1,000 patients), the case of the adjusted-incidence requires specific estimation using risk adjustment within logistic multivariate modelling.
In ECHO, incidence is generally adjusted using as co-variables patients’ age, sex and comorbidities, namely Elixhauser comorbidities. In a few specific indicators, ECHO includes additional factors for adjustment –e.g. major valve interventions concurrent with CABG or STEMI vs. NSTEMI AMI in mortality after CABG.
When ECHO models incidence assumes that risks tend to be more similar among the patients assisted within a specific hospital than among patients from different hospitals, hypothesizing the existence of a cluster effect. As a consequence, adjusted incidence of a specific event is estimated using 2-level hierarchical logistic modeling, where patients are nested into hospitals.
 Interpretation note: Depending on the objective, ECHO may use national benchmarks or international benchmark. In the first case, logistic models will only use, in-country patients and hospitals; in the second case, incidence will be modelled using all patients at risk in all the ECHO countries.
The magnitude of the variation attributed to the hospital
Besides the adjusted incidence, logistic models provide two more statistics: a) the cluster effect - the fraction of variation explained by the hospital, beyond the variation explained by patients; and b) the magnitude of the hospital effect – as compared to patients’ effect.
Hospital-specific analyses are graphically represented by funnel and caterpillar plots. While funnels are generally used to represent hospitals’ incidence of events, caterpillar are meant to position hospitals with regard to the expected incidence.
1. Cluster effect and Magnitude of the hopital effect
1. Cluster effect and Magnitude of the hopital effect
a. Cluster effect
Cluster effect in ECHO is measured by means of the Rho Statistic. A value different to zero would reflect that the incidence of events, beyond differences in case mix, might be also explained by hospital features.
The bigger the rho value, the more likely the hospital of treatment explains the differences in the incidence of events. On the contrary, if Rho equals zero hospitals behave homogenously irrespective of the case-mix of patients and consequently, patients’ differences across hospital cannot be discarded as an explanation of the observed differences in incidence.
b. Magnitude of the hospital effect
The magnitude of the hospital effect, how heterogeneity across hospitals increases the patient odds of experiencing the event of interest, is estimated using the Median Odds Ratio (MOR).
MOR is interpreted as a regular Odds Ratio. For example, a MOR value of 1.50 would represent that the hospital of treatment increases a 50% the likelihood of experiencing the event of interest, in the reference patient.
TECHNICAL NOTE: MOR is estimated by comparing pairs of patients with the same covariates (same risk of experiencing the event of interest) from two, randomly chosen, different hospitals.
A property of interest resides on the fact that in the same model, MOR and the OR for the individual variables are directly comparable.
Close technical note
2. Graphical representation: Funnel plots and Caterpillar plot
2. Graphical representation: Funnel plots and Caterpillar plot
Hospital-specific analyses are graphically represented by funnel and caterpillar plots. While funnels are generally used to represent hospitals’ incidence of events, caterpillar are meant to position hospitals with regard to the expected incidence.
a. Funnel plots
Hospitals’ crude or adjusted incidence is embedded into a funnel plot where confidence intervals are estimated following a Poisson distribution with two levels of confidence: 95% and 99.8%. Hospitals are sorted (x axis) taking as a reference the number of patients at risk.
In terms of interpretation, those hospitals placed above the 95% limit are considered in the alert zone, whereas hospitals above the 99.8% are considered “alarms” (see figure).
In-hospital mortality after CABG utilisation at Spanish hospitals, year 2009

Close funnel
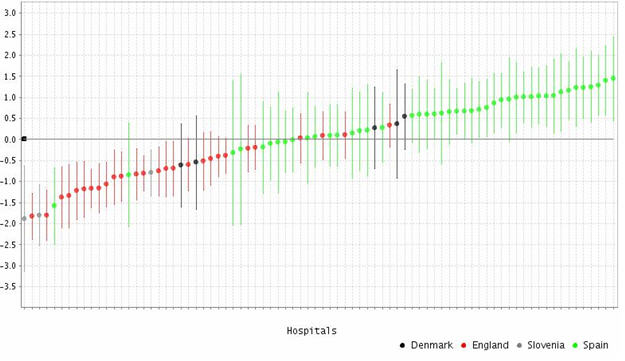
b. Caterpillar plot
Caterpillars represent the difference in the hospital’s incidence of a particular event with regard to the expected incidence for all hospitals’ of study. Since this difference may rank from - ∞ to + ∞, hospitals are sorted from the lower to the highest values.
TECHNICAL NOTE: The difference between the observed and the expected incidence is, actually, the estimated residual for each hospital after the logistic multilevel modelling. Caterpillar plots are then residual graphs exhibiting each hospital effect (and its confidence interval) around the average value (estimated constant value for all hospitals as the expected one). As residuals are assumed to follow a Gaussian distribution, N ~ (0, 1), hospitals’ values moves around 0 in the y-axis.
Close technical note
In-hospital mortality after CABG utilisation at Danish, English, Slovenian and Spanish hospitals. Year 2009
Close caterpillar
Please cite this publication as:
European Collaboration for Healthcare Optimization (ECHO) https://cienciadedatosysalud.org/echo/. Zaragoza (Spain): Instituto Aragonés de Ciencias de la Salud-Instituto Investigación Sanitaria Aragón; c2011. Bernal-Delgado E, Thygesen LC, Martínez-Lizaga N, Comendeiro M on behalf of the ECHO consortium. Handbook on methodology: Measurement of the variation; 2014 Apr 27 [ accessed: date ]; Available from: https://cienciadedatosysalud.org/atlasvpm/ECHO/handbook_14102014/measuring_variation.html