![]() Edificio CIBA
Edificio CIBA
Avda. San Juan Bosco, 13
50009 Zaragoza
What is the aim of AtlasVPM?
Analysis of systematic variations in medical practice
AtlasVPM deals with the analysis of systematic variations in medical practice (VPM) from a territorial and administrative organisation perspective within the Spanish health system (National Health System), and with the analysis of the performance of healthcare providers (mainly hospitals).
This type of analysis is framed within research on health policies and services, and is used to evaluate the experience of care and health outcomes of the population residing in a certain geographical area or using a certain health resource (e.g. hospital) with the aim of measuring the variability observed in medical practice between different units of analysis (i.e. between different areas, regions or between hospitals within and outside the same regions).
AtlasVPM mainly uses spatial analysis methods and techniques, such as small area estimation for geographic area analysis and multilevel linear generalised regression models for the estimation of indicators of use, quality or health outcomes and risk adjustment.
Additionally, AtlasVPM requires the use of other statistical learning methods and techniques such as cluster analysis, or dimensionality reduction techniques (i.e. principal component analysis or factor analysis) in order to segment or classify the units of analysis into comparable groups, or to synthesize relevant information into relevant components or parameters in order to increase the explanatory capacity of the models used and minimise the impact of random (non-systematic) variation on the indicators studied.
What are unjustified variations in medical practice and how are they studied?
Unjustified variations in medical practice
AtlasVPM studies adjusted rates of different indicators and compares them in order to characterise the observed differences, discarding the possibility that these refer to epidemiological factors (i.e., sex, gender, disease burden) or need of care (i.e. prevalence of disease) of the population, that could justify these differences, to focus on those discrepancies that cannot be explained by such reasons. When these unjustified differences are systematically observed, they are referred to as unjustified variations in medical practice, and deserve special attention because they may be highlighting opportunities for improvement in the organisation and delivery of healthcare.
AtlasVPM studies variations in medical practice through the evaluation of indicators of use, accessibility, equity, safety or quality of health care or measurement of health outcomes. In general, these indicators are calculated from a selection of cases of interest (i.e. cases of the phenomenon or event to be measured – hospital admission for a given cause, surgical procedure, diagnostic test, etc.) in a given period of time. The number of cases selected with the characteristic in question during the period of study usually corresponds to the numerator. This numerator is compared against the population of the unit of analysis from which the selection of cases is extracted (i.e. typically the healthcare area or basic health zone, as the administrative demarcation of health service management in the geographical analysis or the population treated in the healthcare provider analysis), with this population being the denominator. These elements -numerator and denominator- enable an average rate of the event in question to be calculated during the period under study.
The calculation of the indicators upon which the geographical variation is evaluated are defined by the formula:
( Selected cases in a healthcare area during the period under study) / (Total population in the healthcare area during the period under study)
= Raw rate of each healthcare area
The calculation of the indicators upon which the healthcare provider’s performance is evaluated are defined by the formula:
(Selected cases relative to an indicator handled by a healthcare provider (hospital) during the period under study) / (Population seen relative to this indicator by that provider (hosptial) during the period under study )
= Raw rate per provider (hospital)
Based on the estimation of this average rate for each unit of analysis (equivalent to an accumulated incidence in the period under study, if the number of cases of interest (i.e. events, procedures, diagnoses, etc.) and persons were comparable, three main routes of analysis are used:
– Describe and compare the rates adjusted by various factors for each of the various geographical areas and assess whether the “cumulative incidence” of a given indicator (case of interest) is greater in some than in others. In order to make this comparison with a certain degree of methodological rigour, it must be ensured that the different units of analysis are comparable to each other, which requires the rates to be adjusted (i.e. risk adjustment of the exposed population by burden of disease) and standardisation by age and gender (using direct standardisation) or using hospitalisation ratios (indirect standardisation).
– Analyse variability by estimating statistics developed for small area estimation.
– Perform a series of secondary ecological-type analyses, to assess whether there is any type of association between rates and some supply variables (i.e. beds, operating room hours, healthcare personnel), demand variables (i.e. deprivation, distance, morbidity, etc.) or others.
What are the AtlasVPM units of analysis?
The Atlas of medical practice variations mainly cover two types of analysis, see a) geographic analysis, based on:
Basic health zone (BHZ)
The basic health zone refers to the reference geographical-administrative area for the provision of primary healthcare services by a primary healthcare team.
Healthcare areas (HA)
The healthcare area represents a higher organisational level than the basic health zone, in which the provision of primary care health services are integrated with specialised outpatient and inpatient care.
And b) hospital analysis based on:
Hospitals offering acute care with publicly funded care activities are considered as secondary care provision units, especially in the provision of surgical operations and subsequent care, but also specialised diagnostic procedures, etc.
The Atlas represents the basic health zones geographically, current health residence areas within the territorial organisation established by the respective health administrations of the 17 Autonomous Communities, covering the entire national territory, except for the autonomous cities of Ceuta and Melilla. For certain indicators, basic health zones and hospitals are also represented geographically by means of geolocalisation.
The healthcare area represents an integrated service provider that encompasses primary care, outpatient speciality care and inpatient care in the context of the Spanish NHS, while the basic health zone is the place for the provision of primary care services.
For certain types of indicators, mainly safety and quality indicators, the performance of hospital centres with public activity is evaluated.
What sources of information does AtlasVPM use?
Numerator: number of cases.
In the indicators that measure hospital activity, the source of information for extracting cases is the Minimum Basic Data Set (MBDS) at hospital discharge and the Major Outpatient Surgery (MOS) records of the 17 Autonomous Communities (ACs) that make up the Spanish National Health System (SNHS).
Denominator: population at risk
The general population is extracted from the municipal census updated and centralised by the Spanish Statistics Office (SSO). These population censuses are broken down into 18 age and gender groups, and distributed on the health maps of each Autonomous Community, in order to reconstruct the populations of each health area and/or each basic health zone.
In the case of hospital analysis, the denominator cases are taken from the MBDS of the 17 Autonomous Communities, in a similar way to the cases of the numerator.
The source of information for extracting cases is the Minimum Basic Data Set (MBDS) at hospital discharge and the Major Outpatient Surgery (MOS) records of the 17 Autonomous Communities (ACs) that make up the Spanish National Health System (SNHS).
Clinical information (reasons for admission, other diagnoses and surgical procedures) and administrative information (age, gender and residency) is obtained from the MBDS and MOS records for each episode of care. The diagnoses and procedures contained in both records are coded according to the International Classification of Diseases 9th revision Clinical Modification (ES-CIE9-MC) and from January 2016, the International Classification of Diseases 10th revision (ES-CIE10-MC).
In the case of indicators that measure Primary Care processes and outcomes, the data is extracted from each of the ACs primary care information systems.
Patient identification and co-payment data is extracted from the health card information system.
Denominator: population at risk.
The general population is extracted from the municipal census updated and centralised by the Spanish Statistics Office (SSO). These population censuses are broken down into 18 age and gender groups, and distributed on the health maps of each Autonomous Community, in order to reconstruct the populations of each health area and/or each basic health zone.
Although the broad population coverage of the SNHS allows for a certain equivalence between the census population and the insured population, there is a mismatch with the persons insured by public mutual insurance companies (basically MUFACE, MUGEJU and ISFAS) who are included in the census denominator, but their cases are only included in the numerator if they were admitted to SNHS hospitals. If the persons insured by the aforementioned schemes, with conditions such as those studied in this Atlas, had a preference for care by private providers, the hospitalisations in the areas with the greatest number of beneficiaries of the those mutual insurance companies would be underestimated.
Where does the data for the analysis come from?
The analysed data is taken from the administrative register of basic minimum information of all hospital discharges released by each of the health departments of the 17 Autonomous Communities, as part of their participation in the AtlasVPM consortium, via bilateral agreements held with the Aragonese Institute of Health Sciences.
The participation of the health departments of the autonomous bodies in the AtlasVPM consortium is established through bilateral agreements between the latter and the Aragonese Institute of Health Sciences. These agreements establish the terms of use of the regional data sets for health policy and services research purposes of the AtlasVPM and the framework for their development.
These agreements enable AtlasVPM access to updated information on the hospital activity publicly financed by the National Health System in the 17 Autonomous Communities from 2002 to 2018 (last available year), and to provide in turn aggregated information on the performance of the health system in terms of activity, quality, safety and performance indicators that are published in the form of the Thematic Variation Atlas.
On the other hand, AtlasVPM works from the data provided with the aim of improving the methods of evaluation analysis, the selection of comparators at the national level, and the quality of the information by producing works and developments of interest to the Autonomous Communities in the form of specific reports, methods or programme developments and new analytical tools or data visualisation formats.
How is the analysis done by healthcare area or basic health zone?
The assignment of cases to each geographical area is one of the essential aspects in the analysis of MPV, since the episodes are counted in the area and/or basic zone of residence and, therefore, are computed independently of the hospital to which the patient is admitted.
The assignment of cases to each geographical area is one of the essential aspects in the analysis of MPV, since episodes are counted in the area and/or basic zone of residence, and therefore, are computed independently of the place, area or Autonomous Community of hospitalisation. In this respect, the analysis carried out compares the experience of hospitalisation of the populations residing in different territories before the admission guidelines used by the hospitals, although obviously they are closely related. Residents in other countries are excluded from this analysis.
On the other hand, the quality of the coding of the municipality -or of the postal district, depending on the case- may differ between hospitals, with cases in which the residence registration field is incomplete. This situation has required rules to be applied for allocating cases, consisting of:
— Cases with a complete residence code are assigned to the healthcare area that includes the corresponding municipality or postal code.
— Cases with an incomplete residence code, but which record the province digits of the Spanish Statistical Office code or postal code, are reassigned to the area of the hospital where the admission took place, provided that this area is within the province identified in the aforementioned incomplete code.
— Cases with an incomplete residence code in which the province identified does not coincide with that of the hospital of admission are excluded.
This assignment normalisation has generally resulted in more than 98% of cases being assigned.
How is a standardised rate by gender and age calculated for each geographic area?
The raw rates by area represent the number of admissions generated (rate numerator) in relation to the population registered in the period (denominator) in that area.
The standardised rates by age and gender represent the rate that an area would have if it had a population with the same distribution by gender and age group as the selected reference population, commonly, the Spanish population registered in the census at that time.
Age and gender are two determining variables of morbidity; therefore differences in their distribution of the population in different areas would justify variability in surgical rates. To control this effect, specific rates are calculated for the age and gender groups in the various core areas and/or zones. Next, the standardised rates by age and gender are calculated, using the Spanish population registered in the census during the period under study as benchmark population. These standardised rates may not coincide with the raw rates since they represent the rates that the different basic areas and/or zones would have if they all had a population with the age and gender distribution of the benchmark population.
From the perspective of the Analysis of Variations in Medical Practice, standardizing by two variables, age and gender, which are of such importance in the burden of disease and death of the populations, enables a comparison of the health areas, discarding the fact that the different epidemiology of the populations studied could be the cause of this variation.
Once calculated, the standardised rates of the total healthcare areas or basic health zones are distributed in quintiles and represented on the maps using shades of colour, with the darkest shades corresponding to the highest rates. The key for each map indicates the range of rate values covered by each quintile (Figure 1).
Figure 1. Map of standardised rates of potentially avoidable hospitalisations by basic health zone (www.cienciadedatosysalud.org/hpe-zbs)
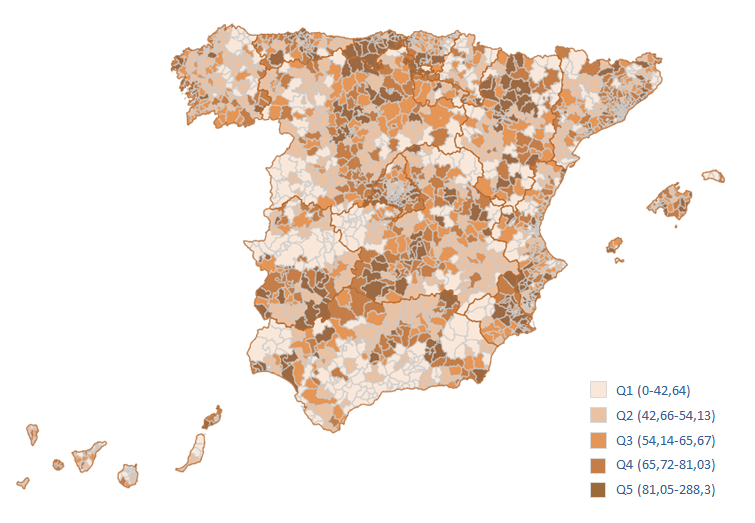
Figure 1. Methods
What is a standardised utilisation ratio and how is it calculated for each geographic area?
Risk of hospitalisation or a more major or minor than expected procedure/surgery. This requires the expected cases in each area to be estimated and then compared against the number of cases observed. This makes it possible to assess whether the behaviour of a unit of analysis is different from what is expected.
Estimating whether the risk of hospitalisation or undergoing a procedure is higher or lower than expected is performed via the ratio of observed to expected cases. This requires the expected cases in each area to be estimated and then compared against the number of cases observed.
The methods for calculating the standardised hospitalisation ratio depend on the method of calculating expected cases. The calculation of these cases can be done following different methodologies.
Standardized hospitalisation ratio (SHR) calculated by indirect standardization. The expected cases are obtained by applying reference rates (specific rates by age group and gender referring to the 17 Autonomous Communities as a whole) to the equivalent population in each area. Expected use would therefore be if the sub-populations of the different territories were to homogenise their hospitalisation levels in accordance with the overall rates. This method does not enable the comparison between areas and/or basic zones, as the structural age and gender differences between them cannot be ignored. However, it does enable each to be compared against an overall pattern, and it can be interpreted as a “relative risk”.
The SHR central value is the unit in which case the area corresponds to the average pattern of use, since what would be expected is observed. The index moves in two directions: from 1 to infinity (over-utilisation relative to the average) and from 1 to 0 (under-utilisation). That scale must therefore be transformed (calculation of the inverse: 1/x) in order to achieve a common expression such as “percentage of over- or under-utilisation”. In this respect, populations with SHR of 1.50 or 0.67, receive 50% more or 50% fewer procedures, respectively, than would be expected from the average utilisation pattern. The 95% confidence intervals were also calculated for this statistic to assess whether or not these ratios are statistically significant.
Standardized Hospitalisation Ratio (SHR) estimated using Bayesian methodology
The Besag-York-Mollie Bayesian methodology is used to calculate the probability that the SHR will statistically exceed the value 1 (higher than expected risk) or have a value statistically lower than 1 (lower than expected risk).
For the representation (Figure 2), two cut-off points are used – a probability between 0.8 and 0.9, high probability that the risk of the event occurring is higher (or lower) than expected; and, a probability greater than 0.9, very high probability that the risk of the event occurring is higher (or lower) than expected. The areas marked in vivid pink show those sanitary areas or basic health zones with higher than expected SHR; while those in brown represent areas with lower than expected risk. The intensity of the colour determines the high or very high probability that the observation is true. Pale yellow represents basic areas or zones with a low probability (less than 0.8) that the observed and expected events will be different.
Figure 2. Risk map of potentially avoidable hospitalisations by basic health zone (www.cienciadedatosysalud.org/hpe-zbs)
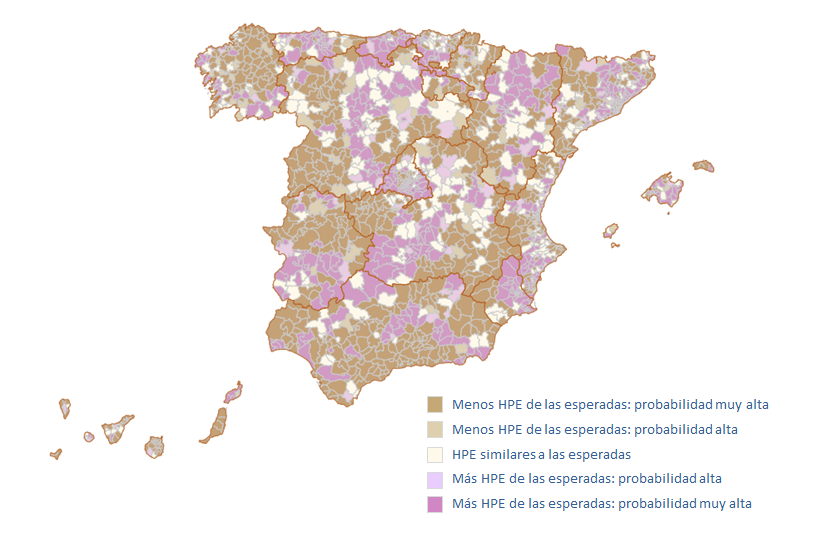
Figure 2. Risk map of potentially avoidable hospitalisations by basic health zone (www.cienciadedatosysalud.org/hpe-zbs)
How is the hospital performance analysis performed?
For certain hospital quality and safety indicators, the performance of the SNHS hospitals is obtained by calculating the risk of a certain event occurring via the quotient between the number of cases observed in the hospital and the number of cases expected, according to the casuistry of the episodes covered. This is done by means of the standardised hospitalisation ratio (SHR).
How is an adjusted hospital ratio calculated for each hospital?
PTo obtain the “expected values” and given the hierarchical nature of the data (episodes grouped by hospital), multilevel logistic regression models are specified. The quality and safety indicators analysed have, as a dependent variable, the occurrence or not of the event and as explanatory variables, depending on the indicator studied, the addition of variables considered most relevant in each case. In general, age, gender and the set of statistically significant Elixhauser clinical conditions (co-morbidities) are used.
Statistical significance comparison of the SHR values is carried out taking into account the volume of patients at risk seen in each hospital, which if represented graphically would be equivalent to the traditional funnel plot (Figure 3).
Figure 3. Spread of Standardised Mortality Rate[1] for acute myocardial infarction in the hospitals with high attended complexity analysed in 2015
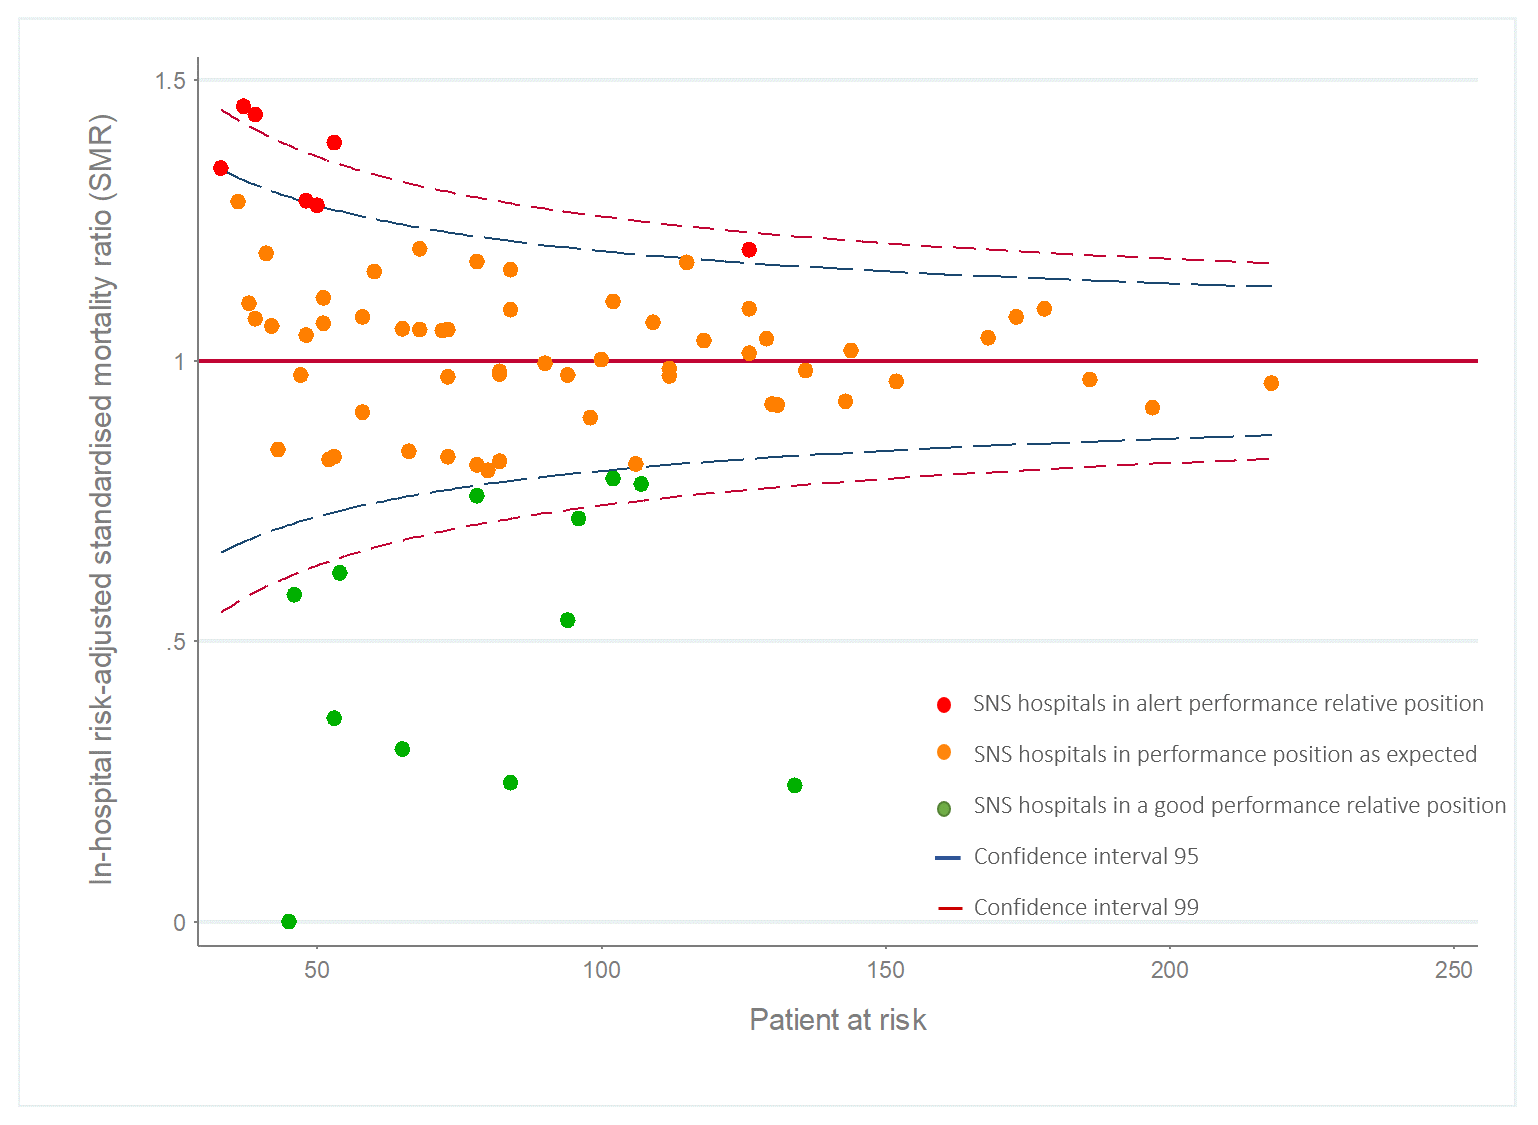
Figure 3. Spread of Standardised Mortality Rate for acute myocardial infarction in the hospitals with high attended complexity analysed in 2015
[1] (Standardised Mortality Rate, SMR, could be considered an SHR sub-type in which the measured outcome is mortality associated with a diagnosis or procedure).
In the case of undesirable events (i.e. mortality), if the SHR of a hospital is significantly lower than the benchmark, it would indicate that the observed events are significantly lower than expected. Hospitals with lower risk are considered Excellent Hospitals or benchmark hospitals. If the SHR is not significantly different from the benchmark, the hospitals are considered Acceptable Hospitals. Finally, if the SHR is higher than the benchmark, i.e. the observed risk is significantly higher than expected the centres will be considered Improvable Hospitals.
On the map showing the geolocation of the SNHS hospitals (Figure 4), they are represented by a circle the size of which is proportional to the population at risk for each indicator (i.e. the population admitted for emergency treatment for heart attacks in the case of mortality indicators for AMI). The colour of the circle represents the relative position of risk in each hospital, determined by the SHR, i.e., to what extent the relationship between the observed and expected values of the hospital differ significantly from the benchmark where the observed and expected value coincide.
Figure 4. Map of in-hospital mortality due to ischemic heart disease
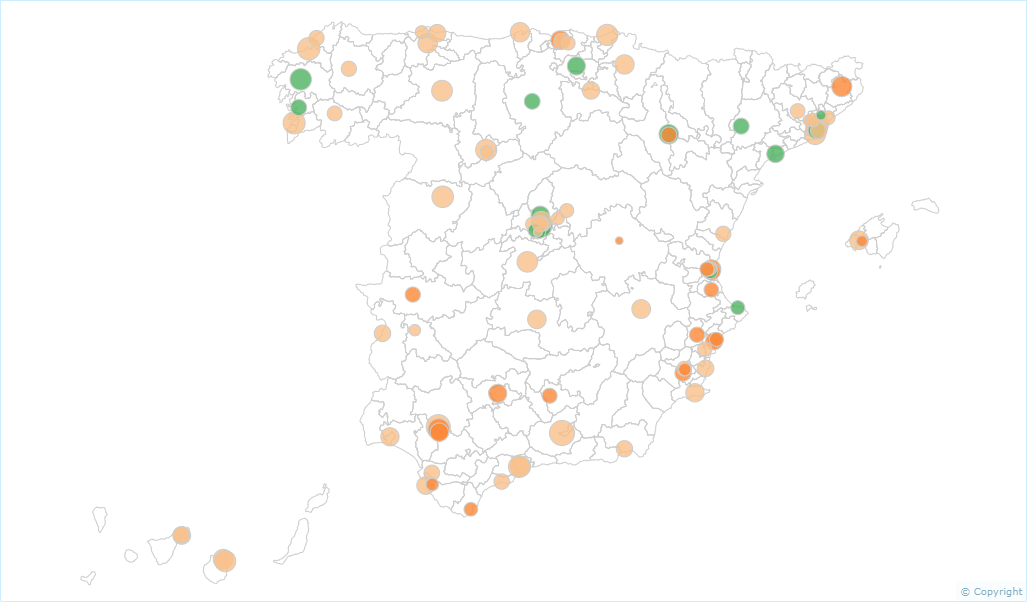
Map of in-hospital mortality due to ischemic heart disease in 2015
Why is the risk adjustment made?
In order to identify and homogenise differences in patients (reference population/ treated population) that may affect the comparison of a health outcome of interest.
In geographic studies, population differences have been “processed” (homogenised, adjusted, controlled) by direct and indirect standardisation, using age and gender, and under the assumption that these are sufficient proxies for epidemiological population differences. The analysis changes when the subjects of the study are the patients in a certain health centre (hospitals in the case study handled by Atlas VPM). Here, age and gender are insufficient and more variables need to be observed: presence of co-morbidity, severity of the underlying disease, etc. There are multiple mechanisms to control differences between providers, and this can be done ex ante, selecting similar patients, for example; or ex post, using what is called “risk adjustment”.
How are health care providers (hospitals) classified? Why is classification necessary?
Based on the indicators analysed, the hospitals are stratified taking into account their organisational characteristics and the level of complexity involved. The purpose of this classification is to be able to compare the health results in terms of the performance of similar hospitals.
In order to ensure comparability between hospitals and to avoid statistical issues in the modelling of results, only the hospitals that presented at least 30 cases of the population at risk for each indicator analysed are included in the hospital analyses (e.g. those that performed more than 30 procedures, in the case of the procedure indicators). This may mean that in the case of time series analyses the number of hospitals analysed varies slightly between the different years of the series.
How is the evolution of the areas or hospitals over time analysed?
Evolution over time. In the case of analysing the evolution of an indicator over time, the standardised rates by age and gender are calculated via the direct method using the population from the first year of the series as a reference.
The evolution of the indicators can be compared against the evolution of a benchmark over the years. This benchmark can be an “average” value (e.g. national median or average rate) or a threshold that marks a desirable maximum or minimum (e.g. p25 in the Atlas of Low-Value Procedures).
In some cases, performing a dynamic analysis of the monthly evolution (or, in its absence, the most fragmented periodicity that the data typology admits) of each indicator may also be of interest using multilevel generalised additive models (GAM) that enable aspects of the evolution over time to be captured. These could include possible seasonal patterns and other calendar-type effects, with the end goal of projecting the expected health performance in the subsequent 12 or 24 months.
What other analyses are performed in AtlasVPM?
FURTHER GRAPHICAL REPRESENTATION
– Violin graphs. These graphs allow you to visualise the distribution of a set of rates or values using a Kernel density function to show them in the form of a violin. In the middle box, the circle represents the median of the values, the box the interquartile range and the “lines” the 95th and 5th percentile.
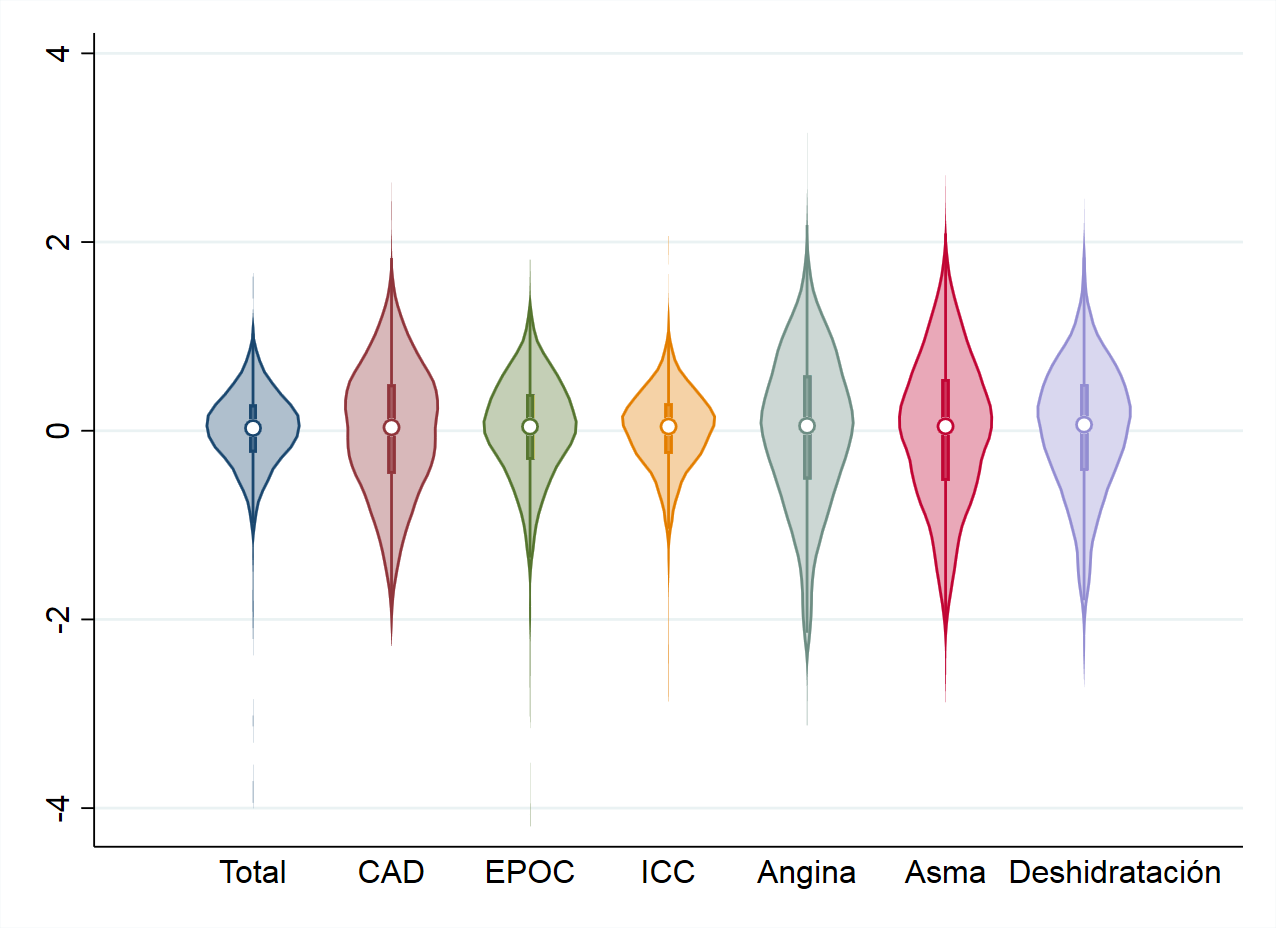
Figure 5.
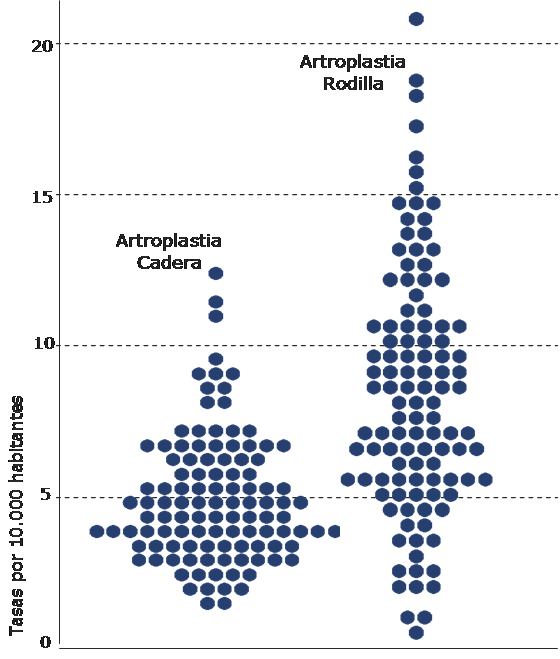
– Dotplots. Each dot represents the value of a rate in a health area. Areas with similar rates are represented at the same level, with the dotplot forming a rhomboid, which will be more symmetrical the more the studied distribution resembles a normal one.
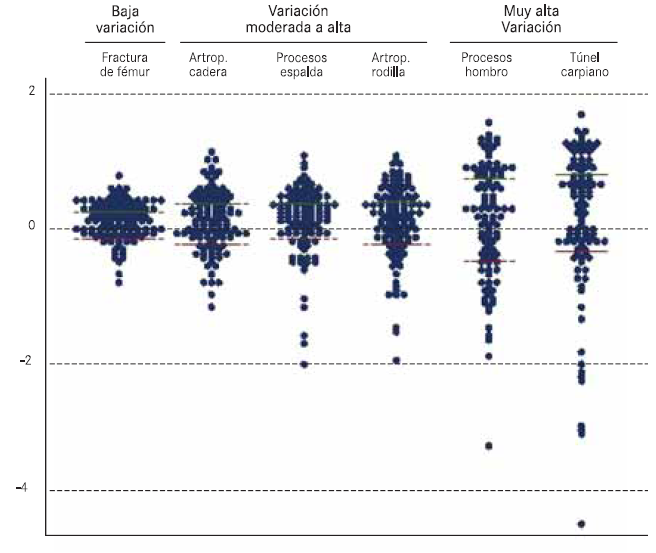
When different indicators are represented whose rates oscillate in very different ranges, the procedures with lower rates are grouped at the base of the graph suggesting less variation. In these cases, the rate is shown in logarithmic scale, enabling this effect to be left out by showing all the values in the same scale. Additionally, the logarithms of the rates are subtracted from the average of the areas, so that the scale is distributed in a common average of 0 value for all the areas analysed.
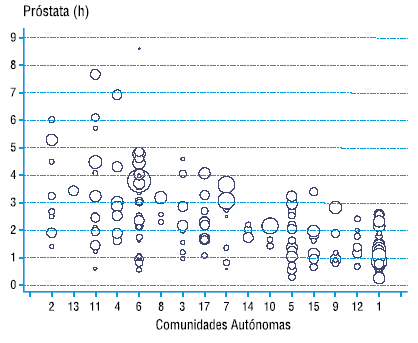
– Bubble charts. These charts are a specific case of the dotplot in which each bubble represents a sanitary area and its size is proportional to the number of inhabitants in that area. The bubbles are grouped by AC in different columns. In Atlas VPM this graph is used to show the variation of the sanitary areas within each Autonomous Community, and to compare areas of different Autonomous Communities with each other. This graph, unlike the previous ones, is only used to represent one procedure.
How can I interpret the variation statistics?
– Variation ratio
The variation ratio (RV) is the quotient between the highest and the lowest value of the standardised rates for all the basic areas and/or zones studied.
It is widely used due to its simplicity and highly intuitive nature. However, it has important limitations, since it is very sensitive to low rates, differences in population size between areas, re-entries and extreme values. It is statistically weak and, if any area has no events -usually in studies in small areas- it offers incongruent values. Currently, it is commonly replaced by the variation ratio between areas at the 95th and 5th percentiles (RV95-5) which reduces the effect of extreme values, and accompanied by the variation ration between the 75th and 25th percentiles (RV75-25) which gives an idea of the variability in the main 50% of observations.
– Unweighted Coefficient of Variation, CVu or CV
This is the quotient of the standard deviation and the mean. The CV expresses the value of the standard deviation in mean units with the advantage, compared to the standard deviation, of not depending on the units of measurement. It can be interpreted in terms of relative variation (more variability the higher the value of the coefficient).
– Weighted Coefficient of Variation, CVw
This is the quotient of the standard deviation between areas and the average between areas, weighted by the size of each area. The CVw is similar to the CVu, although it attaches greater weight to areas with a larger number of inhabitants and better supports the presence of areas with different population sizes. It is one of the statistics of choice when the size of the areas is very different.
– Systematic Component of Variation, SCV
This measures the variation of the deviation between the observed and expected rate, expressed as a percentage of the expected rate. It is a measure derived from a model that recognises two sources of variation: systematic variation (difference between areas) and random variation (difference within each area). This measures the variation of the deviation between the observed and expected rate, expressed as a percentage of the expected rate. The greater the SCV, the greater the systematic variation (not expected by chance).
– Empirical Bayes statistic, EB
The SHR, is an estimator of the “relative risk” of each area, namely, the risk of use in relation to the group considered as the benchmark and depends largely on the population size (its variance is inversely proportional to the expected cases). In this respect, extreme SHRs, and therefore those dominant in the apparent geographical pattern, are the least accurate estimates from areas with few cases. On the other hand, the variability of observed cases is usually much higher than expected in a Poisson distribution (extra-variability).
In order to solve these problems, several alternatives have been proposed. Assuming that the observed cases are distributed in a Poisson distribution, the Bayesian empirical method also assumes that SHR is a random variable that, in our case, follows a log-normal distribution [log(ri) ~ N(m, s2)]. This model is known as a log-normal Poisson mixed model. The EB statistic used here is the estimate of the variance of the log-normal distribution that best fits (likelihood) the geographical pattern of the SHR, taking into consideration the precision of its estimates. It is obtained by the Penalized Quasi Likelihood method. Although it is not very intuitive (it must be interpreted in terms of relative variation), in empirical studies, the EB behaves as a powerful statistic in terms of detecting variability while being the most stable in terms of variability between areas and small frequencies.